E-Commerce Conversion Drivers: Which Factors Have the Biggest Impact on Your Sales?
Discover what e-commerce conversion drivers are and how to use them effectively to boost your sales without additional traffic.

Richard Roth
SEO & GEO Strategist
June 14, 2026
11 min read
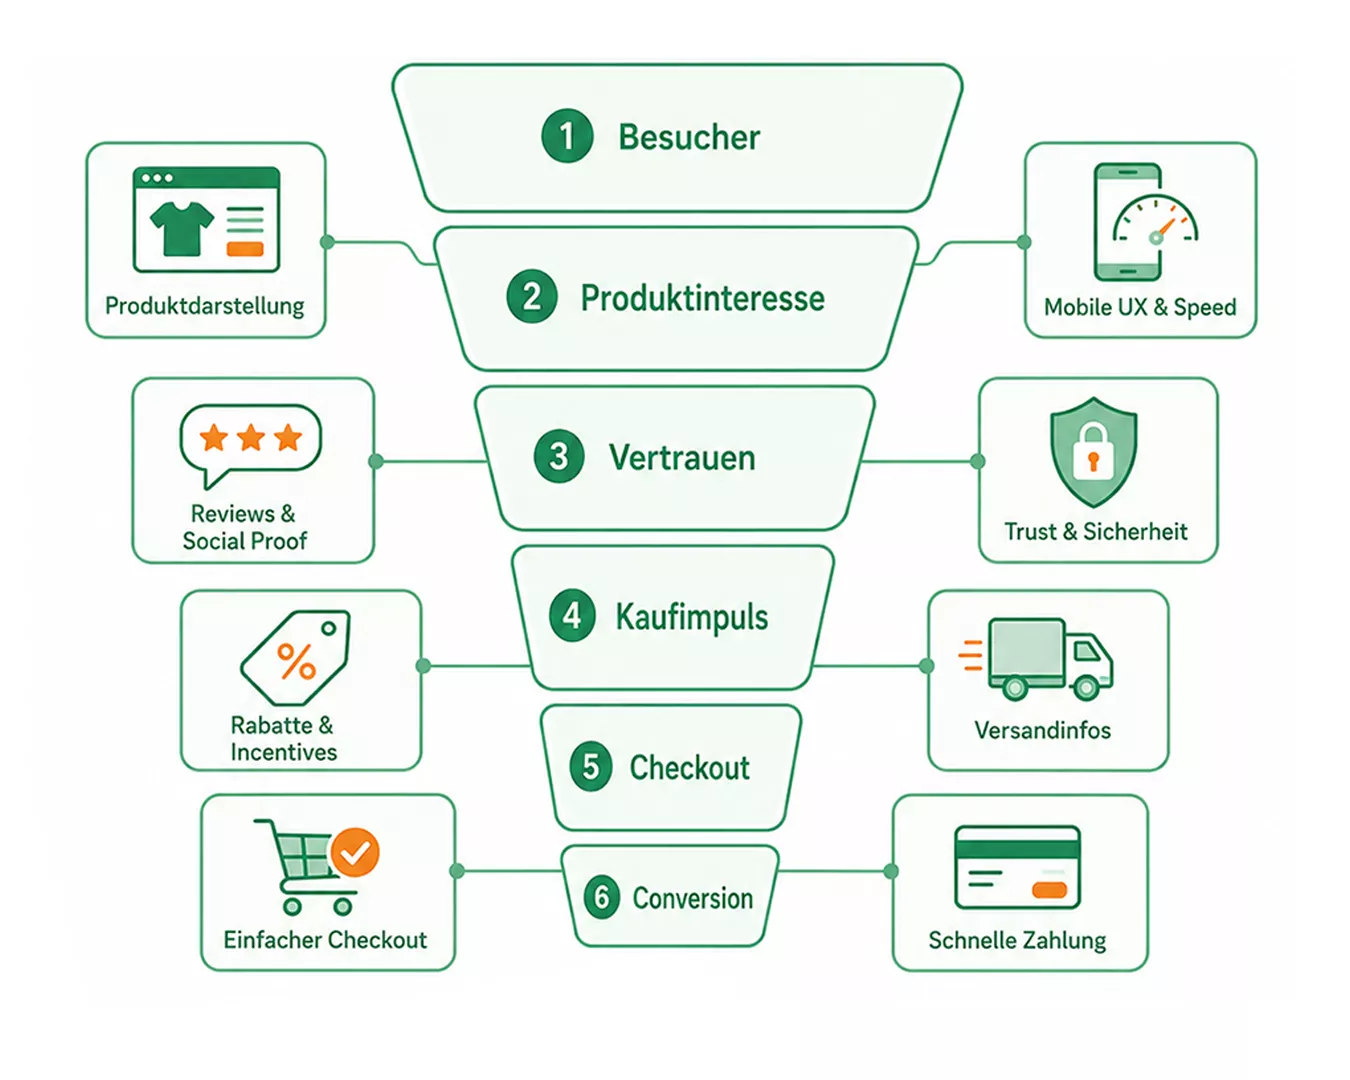
E-commerce conversion drivers are measurable factors along the customer journey that directly determine how many visitors complete a purchase instead of bouncing. In professional terms, this is called Conversion Rate Optimization (CRO). With 50,000 visitors, a conversion rate increase from 2% to 3% already means 1,000 additional orders without investing a single extra euro in traffic. If you want to increase your sales, you need to understand which technical, design, and psychological factors are responsible for conversion.
- • Page speed is critical: Every second of load time costs 2-7% conversions. Target under 2.5 seconds.
- • Checkout abandonment rate exceeds 70%: Optimization can deliver up to 35% more revenue.
- • Above-the-fold decides: CTA, price, reviews, and trust signals must be visible without scrolling.
- • Psychological drivers like security, urgency, and social proof create active purchase motivation.
- • Data-driven prioritization with funnel analysis shows where the biggest levers are.
What Are E-Commerce Conversion Drivers?
Conversion drivers are all elements of an online store that actively move a visitor toward purchase completion. The industry distinguishes between macro-conversions and micro-conversions. A macro-conversion is the completed purchase. Micro-conversions are preliminary actions like adding a product to the cart, creating an account, or opening the checkout page.
This distinction is crucial for practice. Anyone who only looks at the overall conversion rate misses where in the funnel visitors are actually being lost. A store with a good product page but poor checkout has a different problem than a store with a high bounce rate on the homepage.
CRO optimizes existing traffic and increases revenue without additional acquisition costs like paid ads or SEO campaigns. This makes CRO the lever with the highest return on investment in e-commerce. Tools like Google Analytics 4 help capture conversion data and reveal optimization potential.
Which Technical Factors Work as Conversion Drivers?
Technical factors are the foundation of every successful e-commerce optimization. Without a stable technical base, all design and psychological measures fizzle out.
Page Speed: Every Second Costs Revenue
Page speed is one of the most direct and measurable conversion drivers. Every 100 milliseconds of delay costs a store about 1% revenue. Per second of load time, a store loses between 2% and 7% of its conversions. That sounds like little, but for a store with €100,000 monthly revenue, it quickly adds up to several thousand euros per month.
The most important technical levers at a glance:
- Product page load time: Target under 2.5 seconds (Core Web Vitals: LCP)
- Mobile usability: Over 60% of e-commerce traffic comes from mobile devices; missing touch optimization causes direct purchase abandonment
- Checkout friction: Every additional required field in checkout measurably increases abandonment rate
- Payment methods: Missing options like PayPal, Klarna, or Apple Pay are a frequent abandonment reason
- Technical errors: Broken links, failed payments, and slow servers directly cost conversions
Checkout Abandonment Rates as Critical Bottleneck
Checkout abandonment rates often exceed 70%. This means: More than seven out of ten visitors who start checkout don’t complete the purchase. The most common causes are unexpected shipping costs, missing payment methods, technical problems, and poor mobile display.
Checkout optimization can deliver up to 35% more revenue when price transparency, UX, and payment options are consistently improved. The checkout isn’t just a single form but a complex system of trust, technology, and user guidance.
Analyze your funnel step by step with Google Analytics 4. Identify which page has the biggest drop-offs before starting A/B tests. Without this diagnosis, you’re testing blindly.
How Do Above-the-Fold Elements Boost Conversion?
The above-the-fold area of a product page is what a visitor sees without scrolling. It’s the critical moment of decision: Does the visitor stay or bounce? Top performers in e-commerce achieve over 4.7% conversion rate, while the average is around 1.9%. The difference often lies not in the product itself but in the design of this first visible area.
Which Elements Must Be Above the Fold?
The following elements must be visible before a visitor scrolls:
- High-quality product image: The first image decides the first impression
- Price clear and prominent: Hidden prices create distrust
- Call-to-Action (CTA): The “Add to Cart” button must be immediately visible and clickable
- Reviews and star rating: Reviews above the fold can boost conversion by up to 270%
- Trust signals: Trust badges, return guarantees, and secure payment notices reduce purchase hesitation
| Element | Average Effect |
|---|---|
| Star ratings visible | up to +270% conversion |
| Clear CTA button | significantly fewer abandonments |
| Price transparency | reduces checkout abandonments |
| Trust badges (e.g., Trusted Shops) | strengthens purchase readiness |
| High-quality product images | increases time on page |
The placement of these elements is just as important as their mere presence. A CTA button that only appears after scrolling loses much of its effectiveness. The same applies to reviews that only appear at the bottom of the page.
Test your above-the-fold area on a real mobile device, not just in the browser simulator. Many elements visible on desktop disappear below the fold on smartphones.
Which Psychological Factors Influence Conversion?
Psychological conversion drivers explain why small changes to text or UI elements have major impacts on purchasing behavior. A psychological CRO framework describes seven central drivers: progress, curiosity, security, status, autonomy, comfort, and belonging. Each of these drivers can be strategically deployed in store design and product copy.
The Seven Psychological Drivers in Action
- Progress: Progress bars in checkout (“Step 2 of 3”) reduce abandonment because users see the goal ahead
- Curiosity: Product descriptions that raise a question increase time on page
- Security: Trust badges, SSL certificates, and return guarantees lower perceived purchase barriers
- Status: Messages like “Bestseller” or “Only 3 left in stock” activate the desire to belong to the right group
- Autonomy: Options for color, size, or delivery give control and increase purchase readiness
- Comfort: Saved addresses, one-click checkout, and clear return processes lower the decision barrier
- Belonging: Social proof like “1,200 customers bought this product” creates trust through community
Urgency as a psychological driver works very differently depending on the industry. While the cross-industry average is 1.86% conversion rate, categories with high demand pressure achieve significantly higher values. Urgency works best when used credibly and contextually. Artificial countdowns without real basis destroy trust and harm the brand long-term.
The crucial difference between technical and psychological drivers: Technical drivers remove obstacles. Psychological drivers create active purchase motivation. Both together form a complete CRO strategy.
How Do Online Retailers Prioritize Their Conversion Drivers?
The biggest trap in conversion rate optimization is the scattergun approach: improving a little everywhere without knowing where the biggest potential lies. The funnel scorecard approach solves this problem. It separates macro and micro conversions and shows which step of the funnel is losing visitors.
Step-by-Step Prioritization
- Collect funnel data: Set up a conversion funnel in Google Analytics 4 that maps every step from page view to purchase completion.
- Identify drop-off points: Where do most visitors leave the funnel? Product page, cart, or checkout?
- Classify the problem: Is the issue in the trust area (missing reviews, no trust badges) or the technical area (load time, checkout errors)?
- Prioritize measures: Fix problems with the biggest lever first. A checkout problem with 70% abandonment rate has more potential than a small design detail on the homepage.
- Run A/B tests: Test changes in a controlled way to prove real causality, not just correlation.
- Measure results and iterate: CRO is not a one-time project but a continuous process.
| Problem Area | Typical Cause | First Measure |
|---|---|---|
| High product page bounce rate | Missing trust signals, poor images | Revise above-the-fold elements |
| High cart abandonment rate | Unclear shipping costs, missing payment options | Add price transparency and payment methods |
| High checkout abandonment rate | Too many required fields, mobile friction | Simplify checkout, enable guest checkout |
| Low repeat purchase rate | Missing customer retention, no follow-up | Introduce email automation and loyalty programs |
Real-world examples show how effective this approach is. A Shopify relaunch for Barbell Standard achieved a conversion rate of 3.06% and a revenue increase of 195% after technical and design optimization. The result came not from more traffic but from targeted improvement of conversion drivers along the entire funnel.
Continuous monitoring is the difference between one-time success and lasting growth. Those who evaluate their conversion data monthly recognize seasonal fluctuations, technical regression errors after updates, and new optimization potential early.
Key Takeaways
E-commerce conversion drivers only work sustainably when technical foundations, design clarity, and psychological purchase motivation are used together and data-driven.
| Point | Details |
|---|---|
| Technical foundation first | Fix page speed and checkout UX before deploying psychological drivers. |
| Above-the-fold decides | CTA, price, reviews, and trust signals must be visible without scrolling. |
| Use psychology strategically | Security, urgency, and social proof actively increase purchase motivation. |
| Use funnel scorecard | Separate macro and micro conversions to prioritize optimizations precisely. |
| Measure continuously | A/B tests and monthly monitoring ensure long-term conversion success. |
What I’ve Really Learned After Years in Practice
Many merchants who come to us have the same pattern: They’ve invested in ads, traffic is there, but the numbers aren’t moving. The first reflex is usually to put even more budget into advertising. That’s the wrong approach.
What I see again and again in practice: The biggest conversion levers aren’t in marketing but in the store itself. A checkout with seven required fields on mobile destroys more revenue than any bad ad. And a product image that looks pixelated on smartphone costs more than mediocre product copy.
The second common mistake is overweighting psychological drivers without technical foundation. I’ve seen stores that built elaborate urgency banners and social proof elements while mobile load time was over four seconds. That’s like decorating a shop window while the front door is stuck.
My honest recommendation: Always start with data analysis. Google Analytics 4 shows you in a few hours where your funnel breaks. Only then is it worth using A/B testing tools like VWO or Optimizely. Testing without diagnosis wastes time and budget.
What always surprises me: Small changes with big impact. A merchant in our network noticeably increased their conversion rate within three weeks just by adding star ratings above the fold. No new platform, no new design. Just the right information in the right place.
CRO is not a sprint. It’s a structured process that requires patience, data, and willingness to question assumptions. Those who understand this have a real competitive advantage.
— Richard
How Store2x Supports Conversion Optimization
Technical conversion drivers only reach their full effect on a platform designed for them. Store2x migrates online stores from WooCommerce, Shopware, Magento, PrestaShop, and other systems to Shopify – SEO-safe and without data loss.
With over 45 completed migration projects and an average go-live time of three weeks, Store2x delivers a fast, low-risk platform switch. The result: a technically clean store that forms the foundation for all further conversion measures. Anyone planning their store migration to Shopify or wanting to position their existing store for more conversions will find experienced Shopify experts and SEO specialists with proven results at Store2x.
 Frequently Asked Questions